The CANTCU LogViewer is used to view .TCUlog files recorded through PC or internal logging.
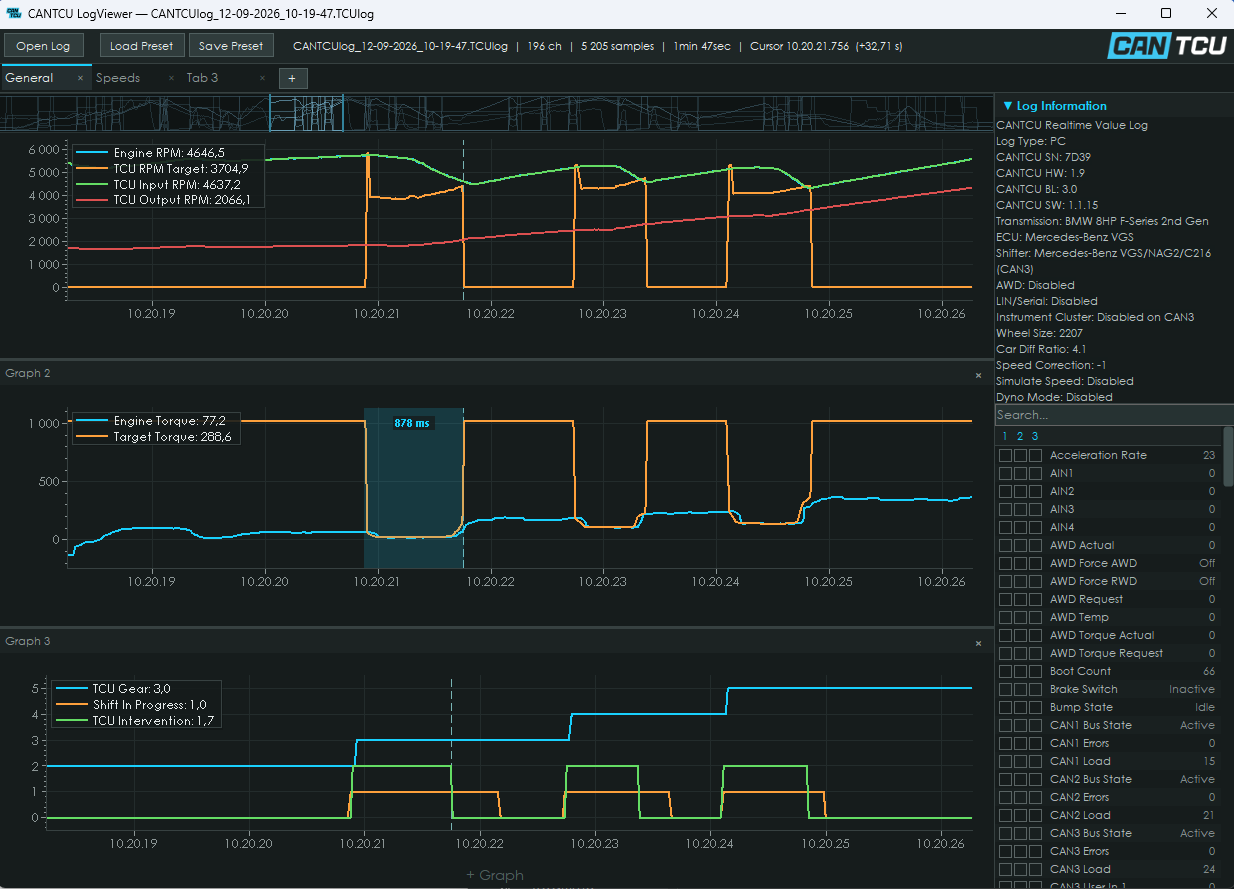
¶ Opening a Log
Open:
Logging → Open Datalog...
or use Open Log inside the LogViewer.
.TCUlog files can also be opened directly from Windows.
¶ Graphs
Select realtime values from the list on the right to add them to the active graph.
Multiple graphs can be added to the same tab using + Graph.
All graphs in the active tab share the same time position and zoom level.
¶ Controls
- Left-drag - Pan
- Mouse wheel - Zoom in/out
- Middle-drag - Select an area to zoom
- Right-drag - Measure a time span
- Double-click graph - Reset zoom
Moving the cursor over the graph shows the values at that point in time.
¶ Tabs
Separate tabs can be created for different groups of signals.
For example:
- General
- Speeds
- Pressures
- Shift analysis
Press + to add a tab.
Double-click a tab name to rename it.
¶ Variable Search
Use the Search field above the realtime-value list to quickly find a signal.
¶ Log Information
The Log Information panel shows information stored with the log, including CANTCU hardware/software and the configured transmission, ECU, shifter and vehicle settings.
¶ Markers
Markers created during PC logging are shown as highlighted areas in the graphs, making marked events easy to find.
¶ Presets
The complete graph layout can be saved using Save Preset and restored using Load Preset.
Presets store the selected variables, tabs, graphs and display settings.